From Drafting Tools to Spatial Generation Systems
The Integration of LLM-based Bubble Diagrams and Multi-Agent Design Systems
Advancements in digital technology are transforming architectural design tools from simple drafting instruments into sophisticated systems capable of generating and evaluating spatial arrangements. Particularly, Large Language Model (LLM)-based design tools are evolving into systems that automatically produce spatial relationships and suggest optimized layouts based on designers’ input. This article examines how traditional bubble diagrams are being reinterpreted and integrated into contemporary automated design systems.
Bubble Diagrams: Concept and History
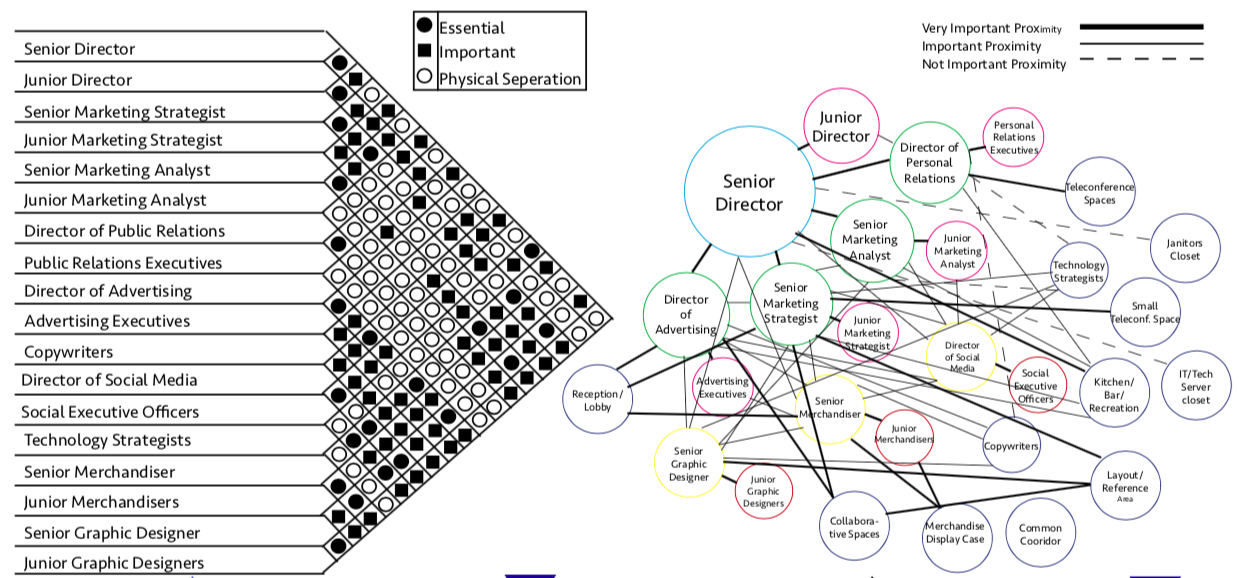
Bubble diagrams are visual tools used to abstractly represent spatial relationships, widely utilized during initial planning phases in architecture and interior design. By representing spaces as circles (bubbles) connected by lines, they intuitively illustrate functional adjacencies and circulation patterns, aiding in quickly understanding overall spatial structures.
Origins and Development
- 1929: Le Corbusier’s sketches during a lecture in Buenos Aires, featuring simple circles and lines, are considered early examples of functional relationship diagrams.
- 1937: Percy Nobbs systematized the concept in his book, “Design: A Treatise on the Discovery of Form.”
- 1940s: Walter Gropius introduced bubble diagrams as educational tools at Harvard’s Graduate School of Design (GSD).
- 1950-60s: Widely adopted in hospital and large office planning manuals as standard practice.
Limitations
Traditional bubble diagrams, heavily reliant on the designer’s intuition, possess inherent limitations:
- Ambiguity: Potential mismatch between physical and functional distances.
- Lack of Quantitative Analysis: Limited capability to reflect variables like area requirements, occupant numbers, and directional constraints.
- Difficulty in Validation: Time-consuming comparison and validation of multiple scenarios.
Digital Transformation and Automation
The introduction of CAD-based tools digitalized bubble diagrams but remained primarily passive. Recently, automated bubble diagram generation systems emerged, automatically computing adjacency, area allocation, and layout constraints based on user input.
The core of this transformation is that design tools now act as partners engaging actively in the design process rather than merely documenting outcomes.
LLM-based Spatial Relationship Generation Systems
LLM-based adjacency graph generation systems analyze spatial requirements expressed in natural language, automatically creating relationship diagrams between spaces.
Key Features
- 🧩 Automatic Template Generation: Standard templates based on space types and occupancy.
- 🧭 Directional Constraints: Interpretation of conditions like “south-facing lounge” or “north entrance.”
- 📐 Area-Based Allocation: Calculation and adjustment of space areas according to functions.
- 📋 Guideline Application: Incorporates architectural standards and industry guidelines.
- 📊 Visualization and Documentation: Multiple output formats including JSON, HTML, and SVG.
When a user inputs: "A startup office for 20 people with the reception near the entrance, lounge facing south, and meeting room next to the CEO's office," the system parses these conditions, generates appropriate spatial relationships graphically, and proposes an optimal layout.
Multi-Agent System: Structure and Role
Complex spatial design problems are more effectively handled by specialized Multi-Agent Systems, which distribute tasks among agents interacting with GPT-4o.

Roles of Agents
- Agent 1: Spatial Layout Analysis
- Generates initial layouts based on relationships and usage scenarios.
- Agent 2: Directional Constraints
- Interprets conditions like orientation (e.g., “south-facing lounge”).
- Agent 3: Occupancy Optimization
- Calculates space requirements based on organizational scale and density.
- Agent 4: Guideline Compliance
- Evaluates compliance with industry standards and building regulations.
- Agent 5: Area Optimization
- Prevents over/under-sized spaces and suggests strategies for residual area utilization.
Conclusion: Reinterpreting Bubble Diagrams
Bubble diagrams have evolved from simple hand-drawn sketches into sophisticated planning generation tools through the integration of LLM and multi-agent systems. This transition represents more than digitalization—it fundamentally reshapes the designer’s thinking, with implications such as:
- Design becoming an interactive conversational process rather than merely a drawn outcome.
- Designers focusing more on creative thought, delegating repetitive computations and constraint verifications to automated agents.
- Simultaneous achievement of accuracy, speed, creativity, and functionality.