Improving AVM with Duplicate Data Integration
Topic
When using transaction data for both multi-family housing and officetels, there exists a class imbalance where officetel data is about one-tenth the level of multi-family housing data. When using the combined data without any preprocessing, we discovered that the model was relatively more fitted to multi-family housing data compared to officetels during training, resulting in higher predicted prices for officetels. Therefore, we aim to experiment with methods to reduce bias caused by data imbalance when developing an integrated model for multi-family housing and officetels.
Method
The first approach that can be considered to solve the data imbalance problem is customizing the loss function. However, it was difficult to arbitrarily modify the loss function in the currently used AutoGluon package, and customization had limitations as a subjective method. Therefore, we tested the hypothesis that “Data Duplication can be used instead of Loss to make the impact of specific data points’ loss greater on the overall loss function” - an idea that meets our criteria of being both independent from the AutoGluon package and more systematic.
Result & Analysis
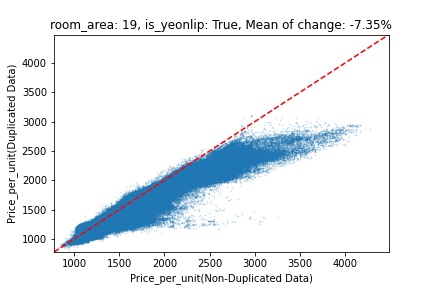
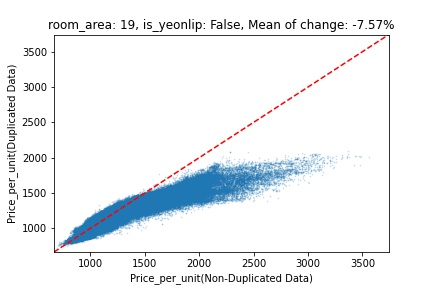
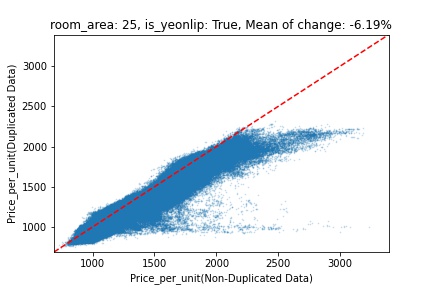
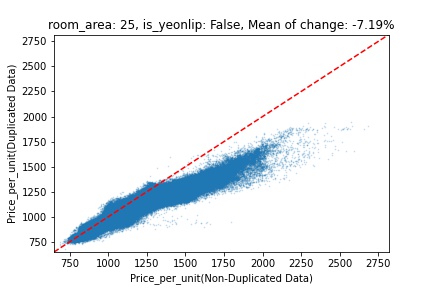
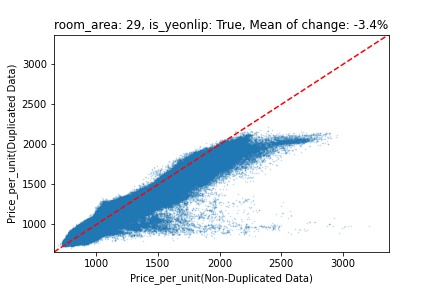
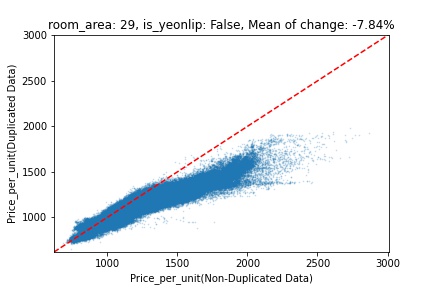
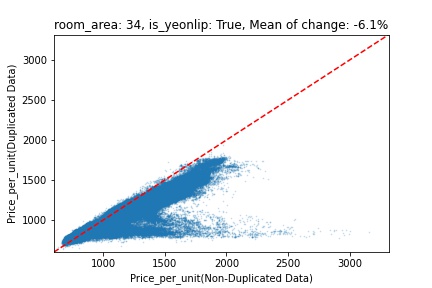
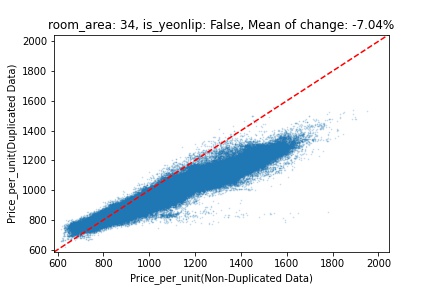
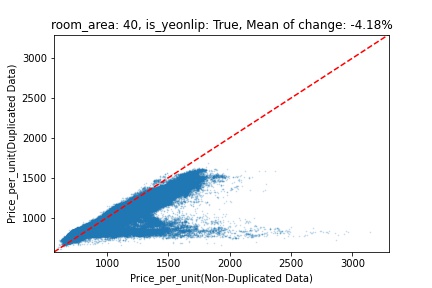
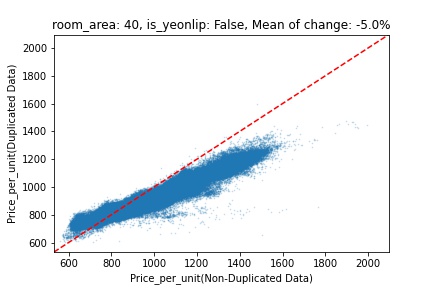
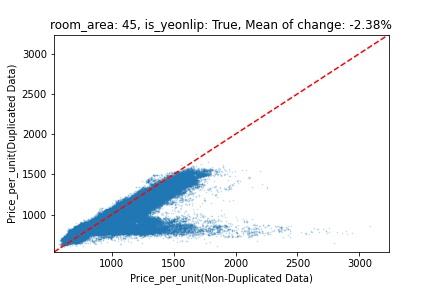
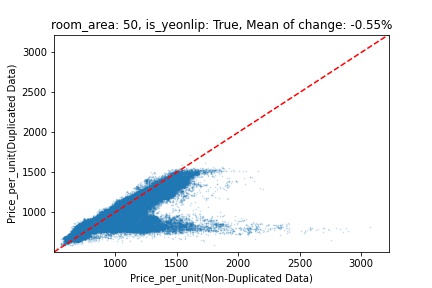
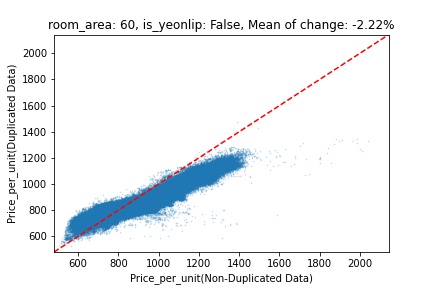
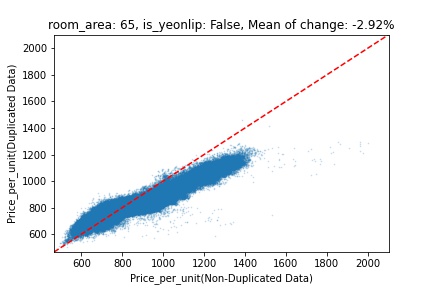
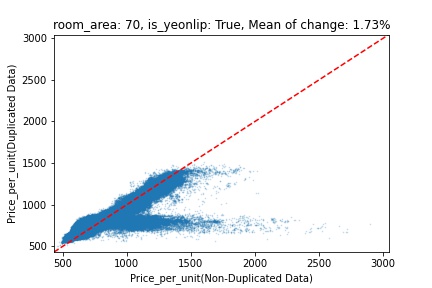
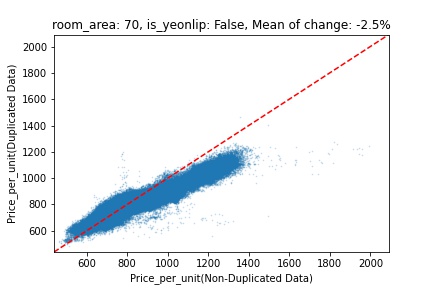
Changes by Area and Type
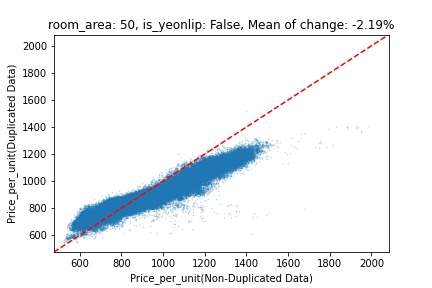
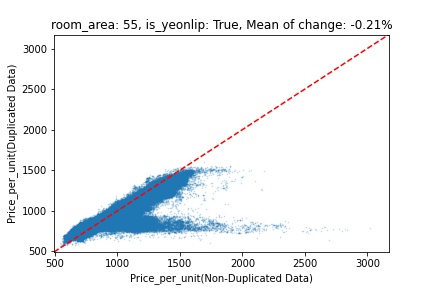
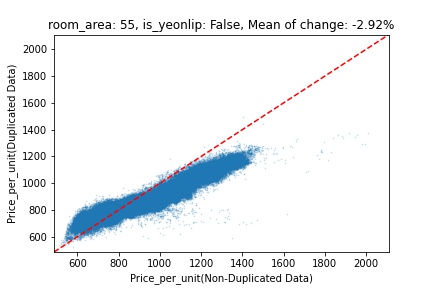
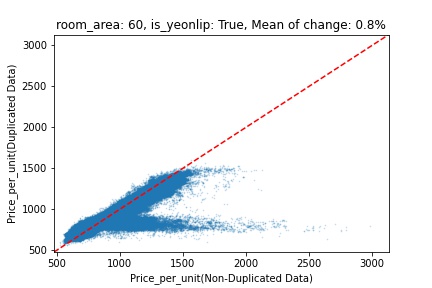
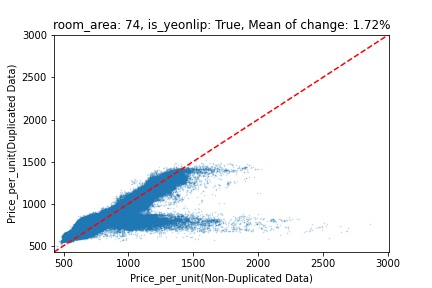
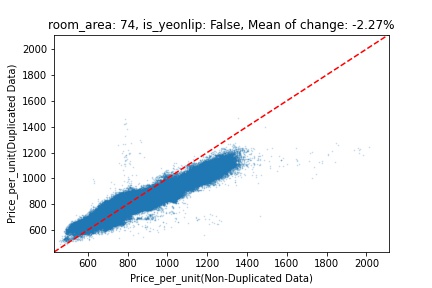
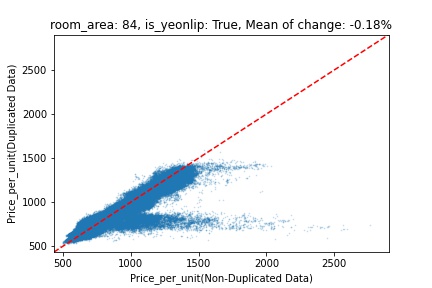
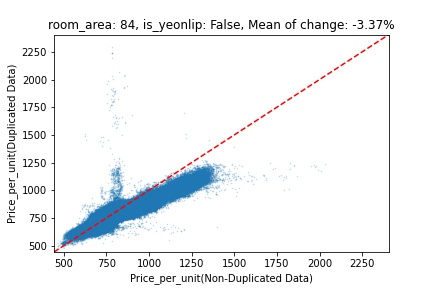
When plotting the changes by area and type, we can confirm that the integrated model using duplicate data generally shows lower results compared to the existing integrated model. However:
- While officetel results show linearity between the two models, multi-family housing shows no particular linear relationship, and there are cases where the differences between the two models are relatively large.
- For officetels, as the size increases, there were many extreme cases of differences between the two models (wider vertical and horizontal ranges, and more points deviating from the trend).
- Figure
- Left: Multi-family housing / Right: Officetel
- X-axis: Existing integrated model / Y-axis: Integrated model using duplicate data


Change Amount Scatter Plot
We mapped the changes on a map to check if there were differences in the amount of change by region. For multi-family housing, we can see many cases with large differences between the two models in the Gangseo area, while for officetels, many differences were observed in the Seodaemun-gu area. Through additional experiments and investment team QA, we believe it’s necessary to identify what commonalities exist between regions with significant differences.
- Figure
- Left: Multi-family housing / Right: Officetel
- Color: Amount of change
.png)
.png)
.png)
.png)
.png)
.png)